


"WATCHING THE WEATHER TO PROTECT LIFE AND PROPERTY"
Monthly Climate Summary August Hato Airport Curacao (9/2/2020)
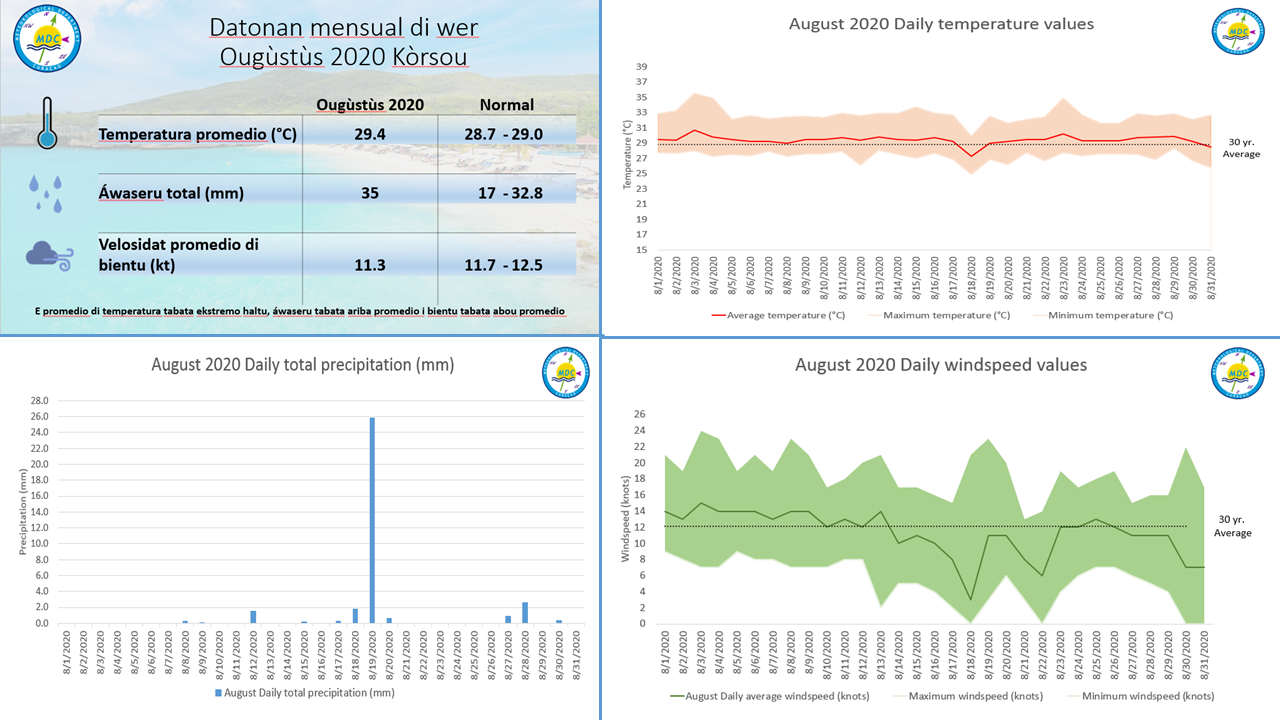
Table (top left):
Climate values measured at Hato Aiport Curaçao.
Daily average temperature.
Monthly total precipitation.
Daily average wind speed.
Graph 1 (top right):
Red line represents daily average temperatures.
Red area represents the minimum (bottom) and maximum (top) temperature for each day.
Graph 2 (bottom left):
Blue bars represent the total amount of precipitation for each day.
Graph 3 (bottom right):
Green line represents daily average wind speed.
Green area represents the minimum (bottom) and maximum (top) wind speed for each day.